A Year of Workouts
Visualizing workout data.
A Year of Workouts
Visualizing workout data.
Tools
p5.js, Adobe Illustrator, Google Sheets
Description
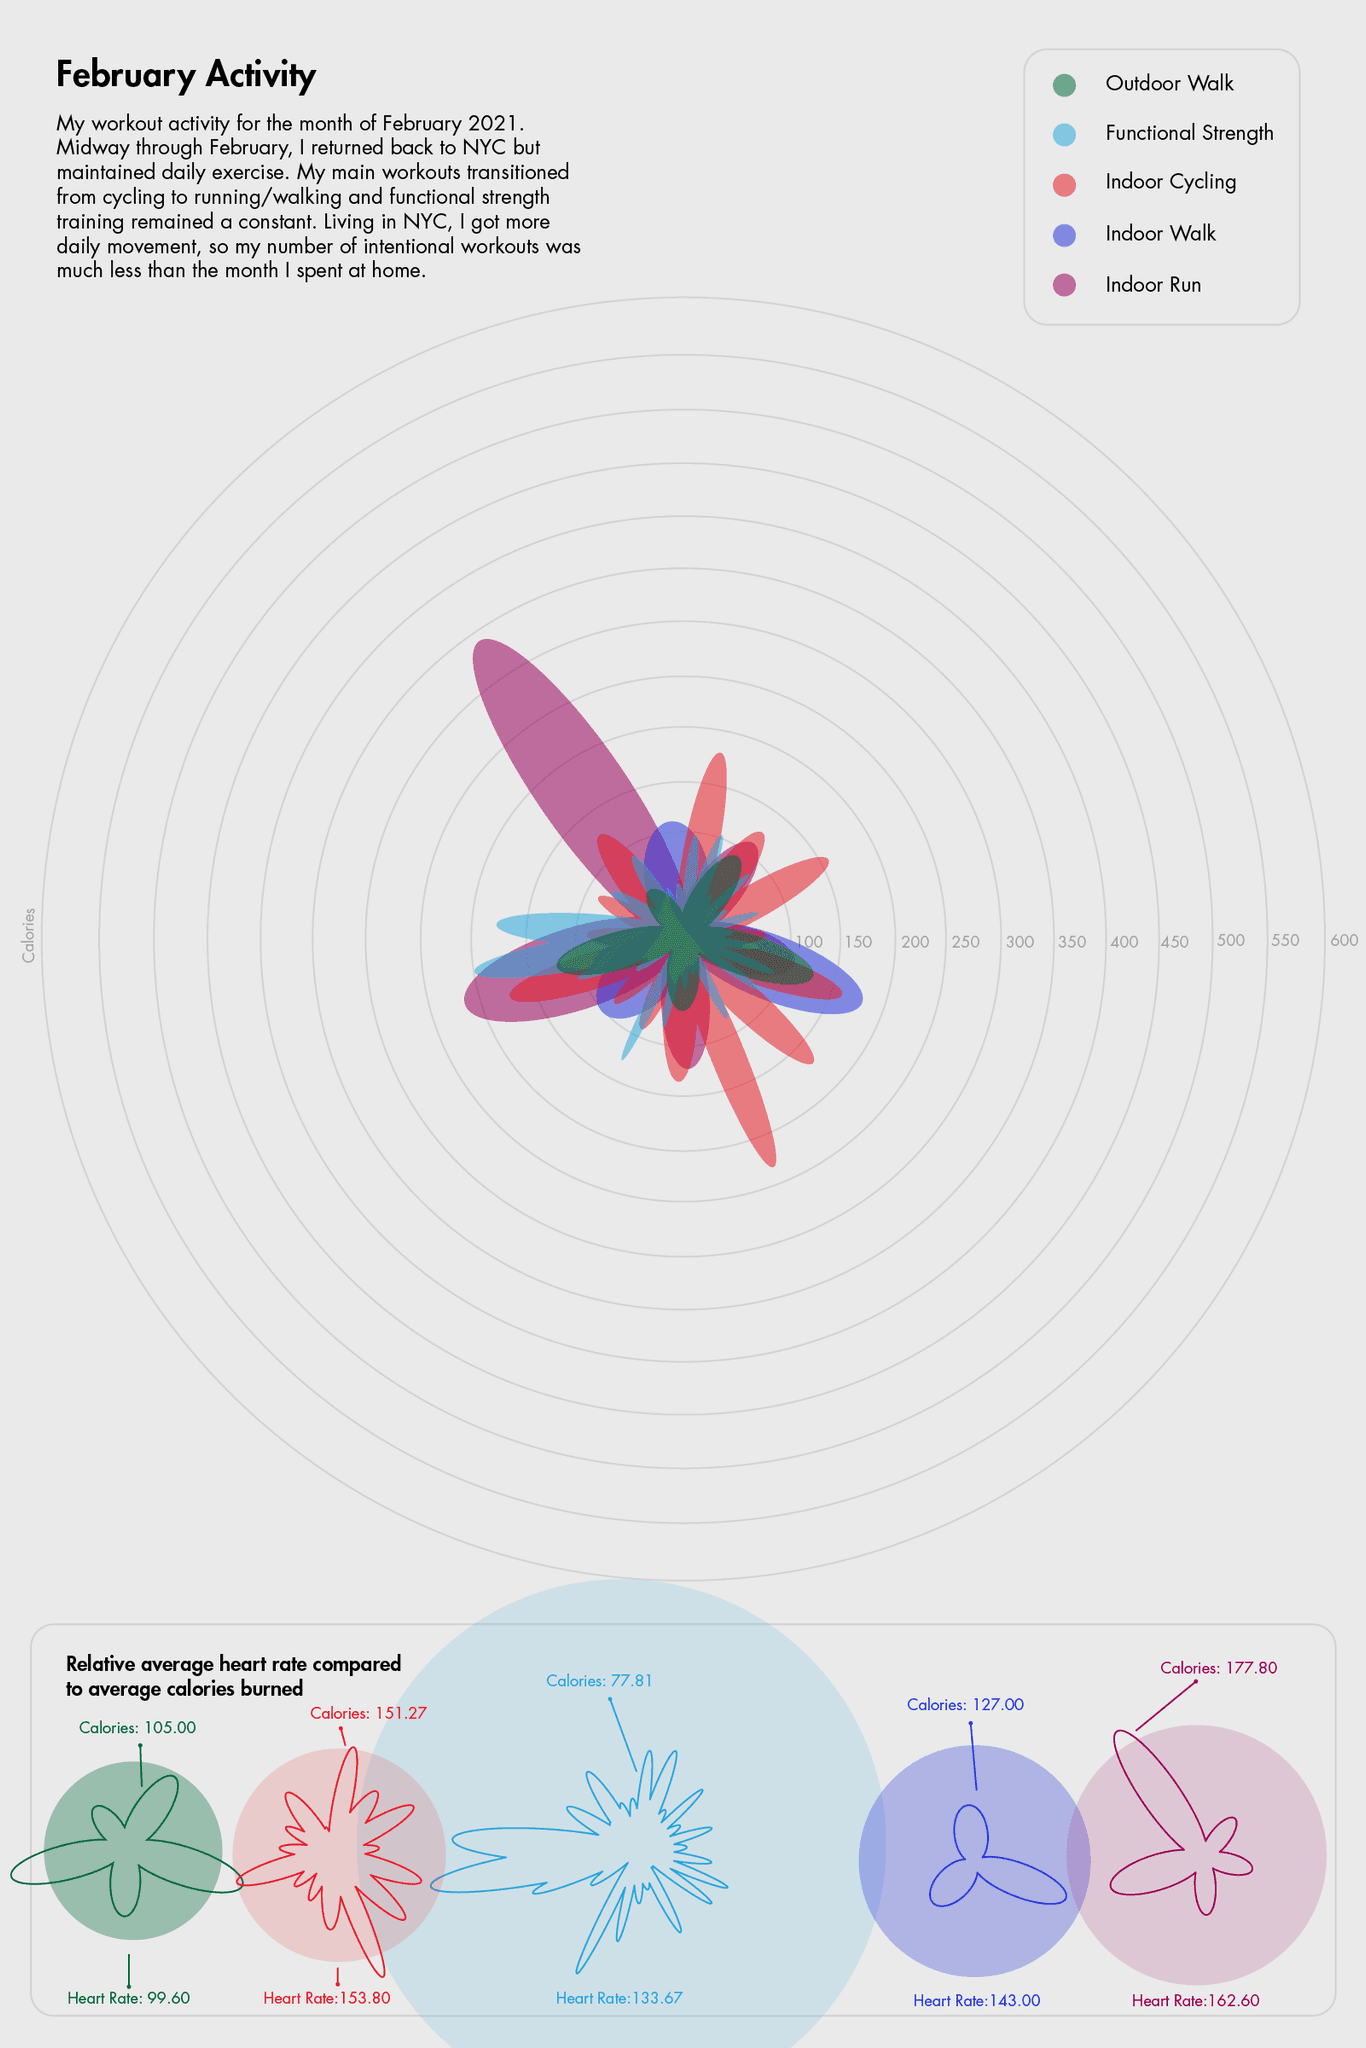
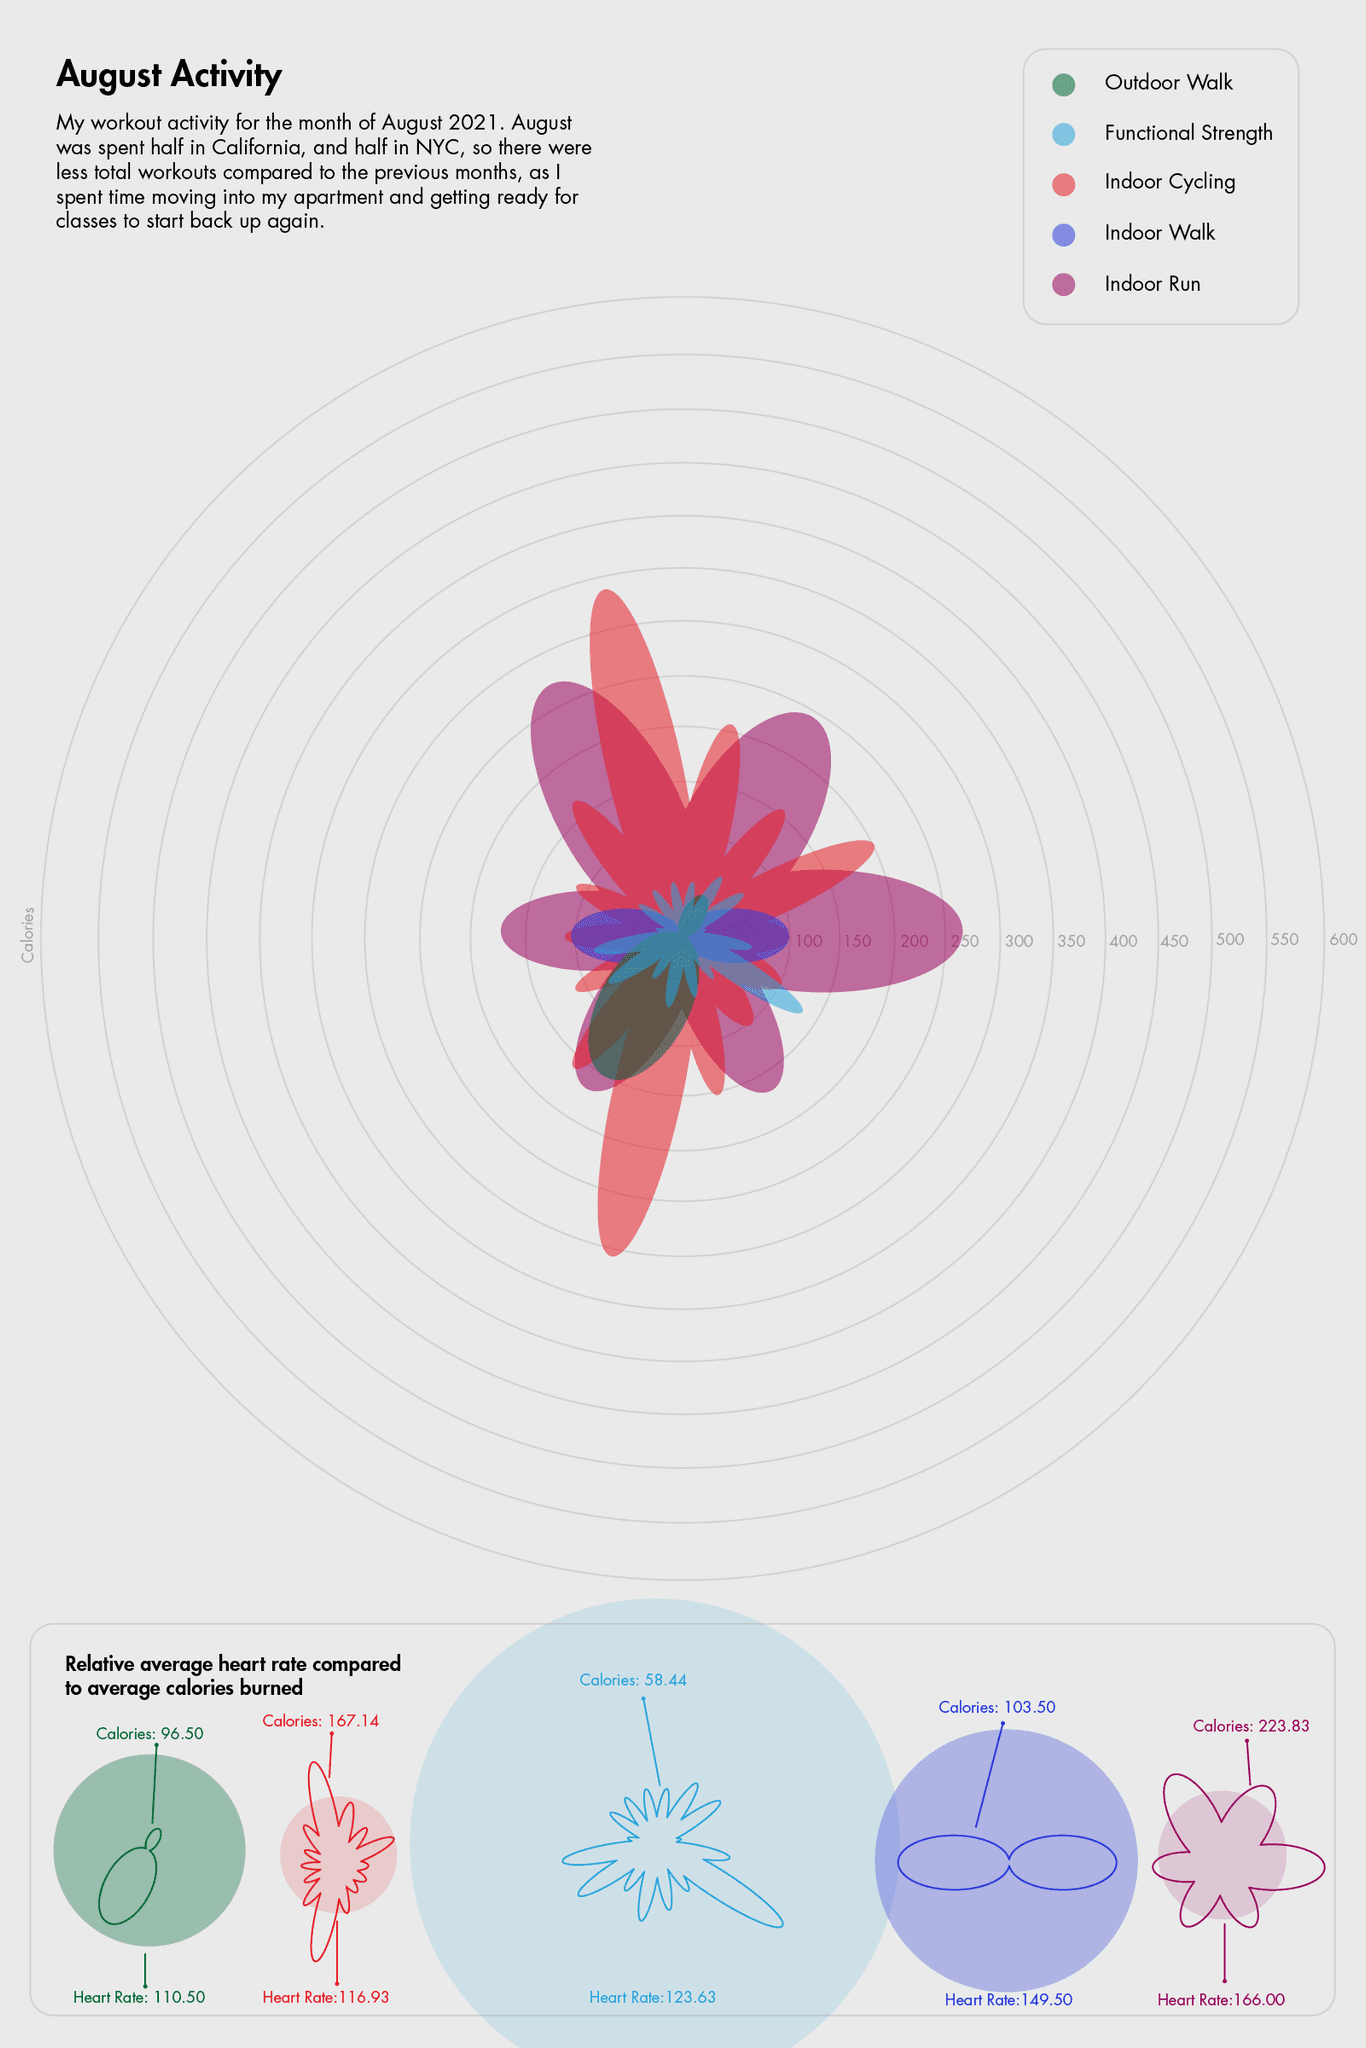
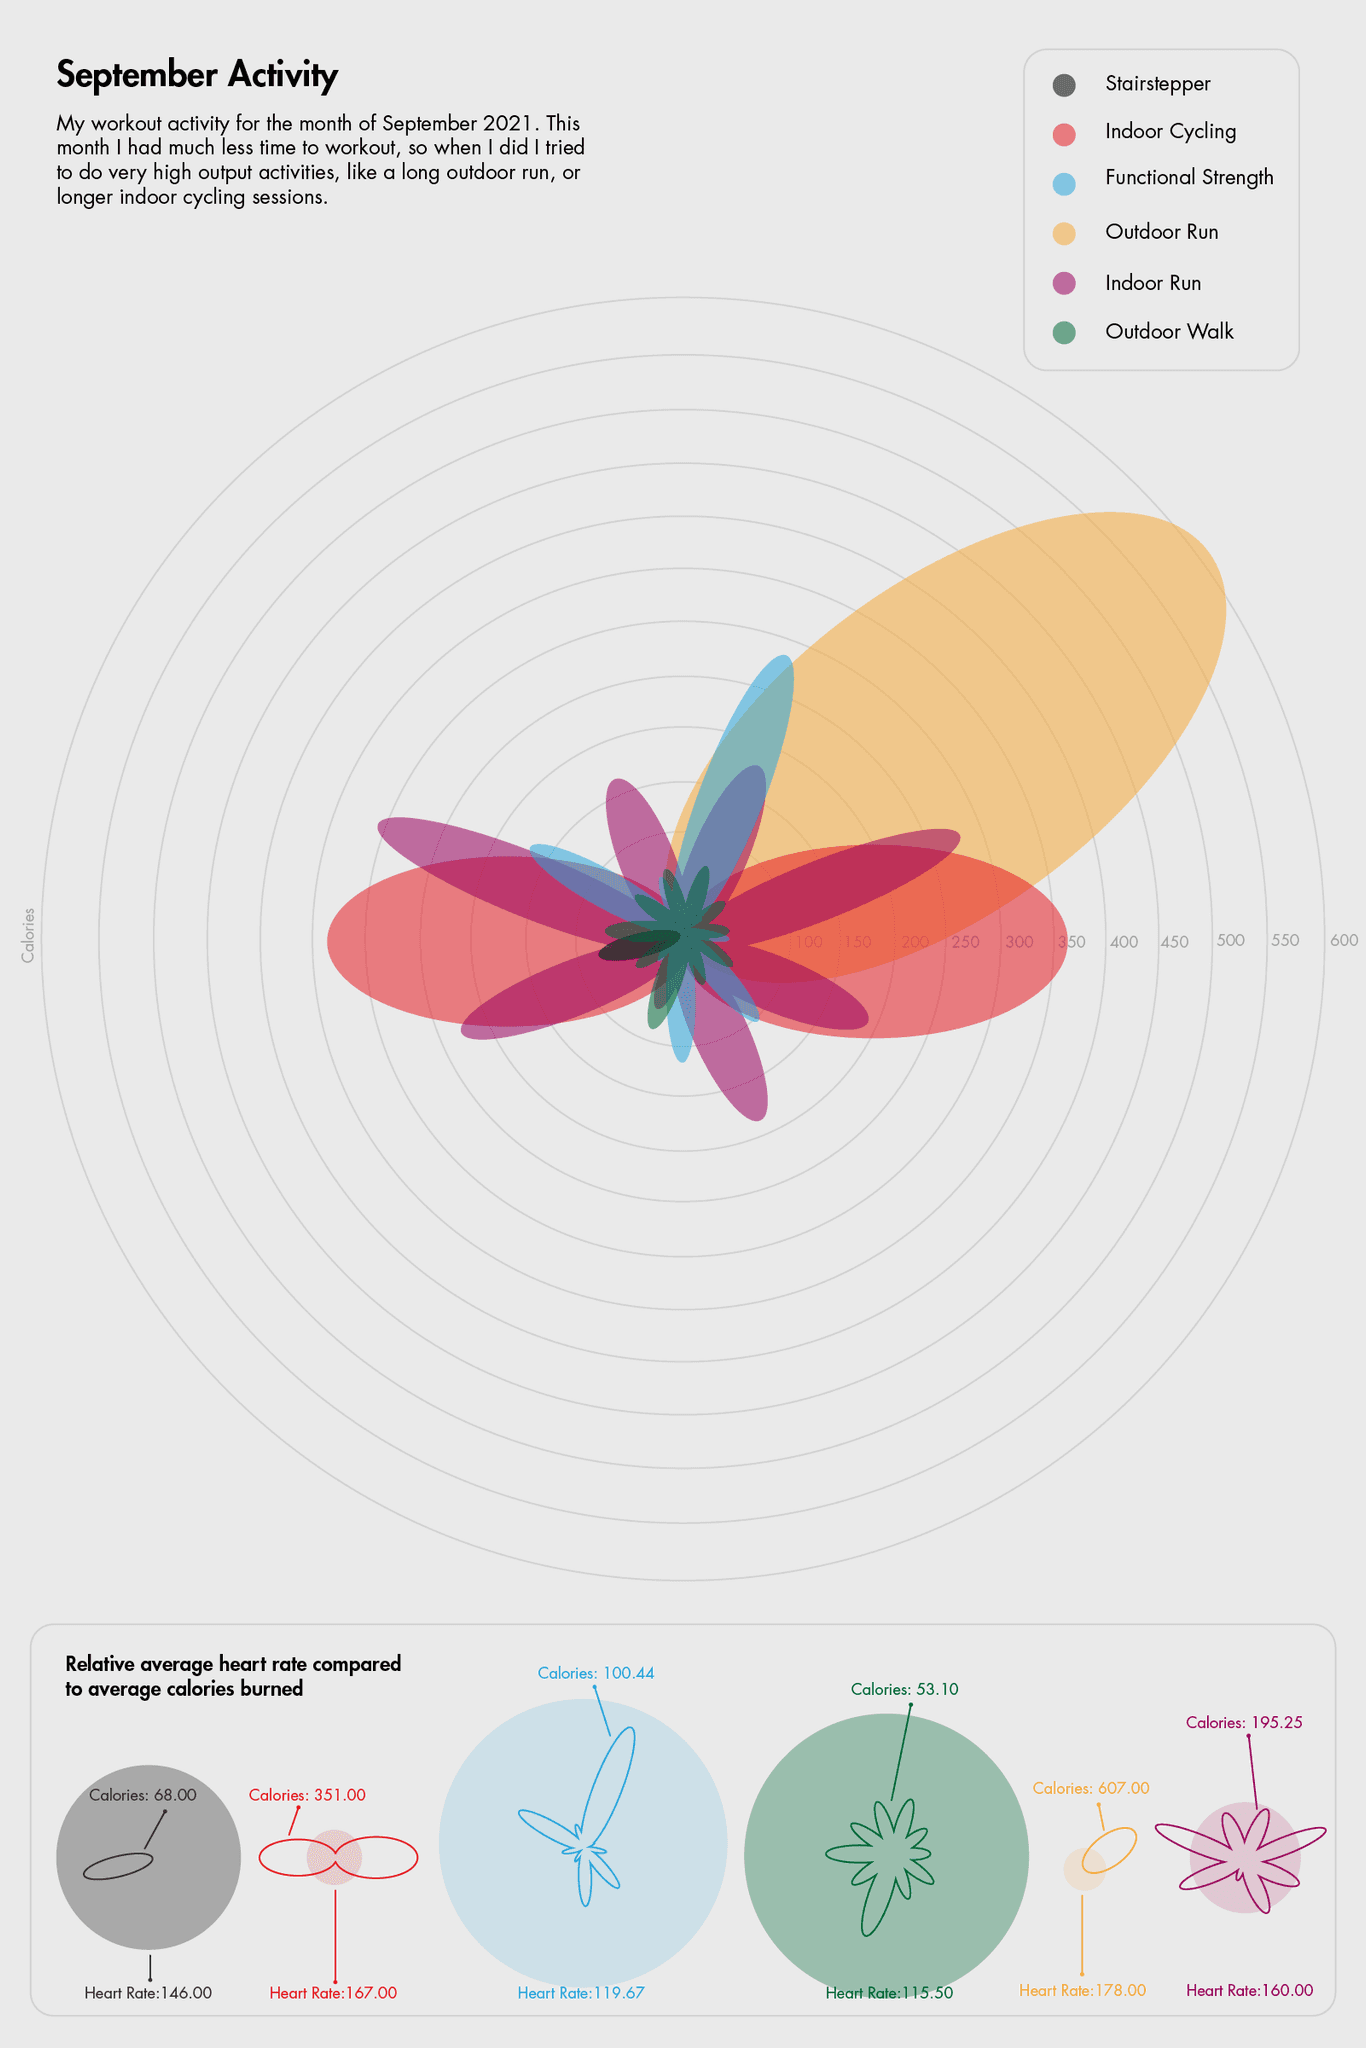
This project contains a year's worth of workouts, visualized. To do so, I compiled all of my workout history into spreadsheets in order to have all the data contained in one place. I then used p5.js to create graphs with accurate data, and then I made the graphs a bit more interesting with Adobe Illustrator.
Monthly History
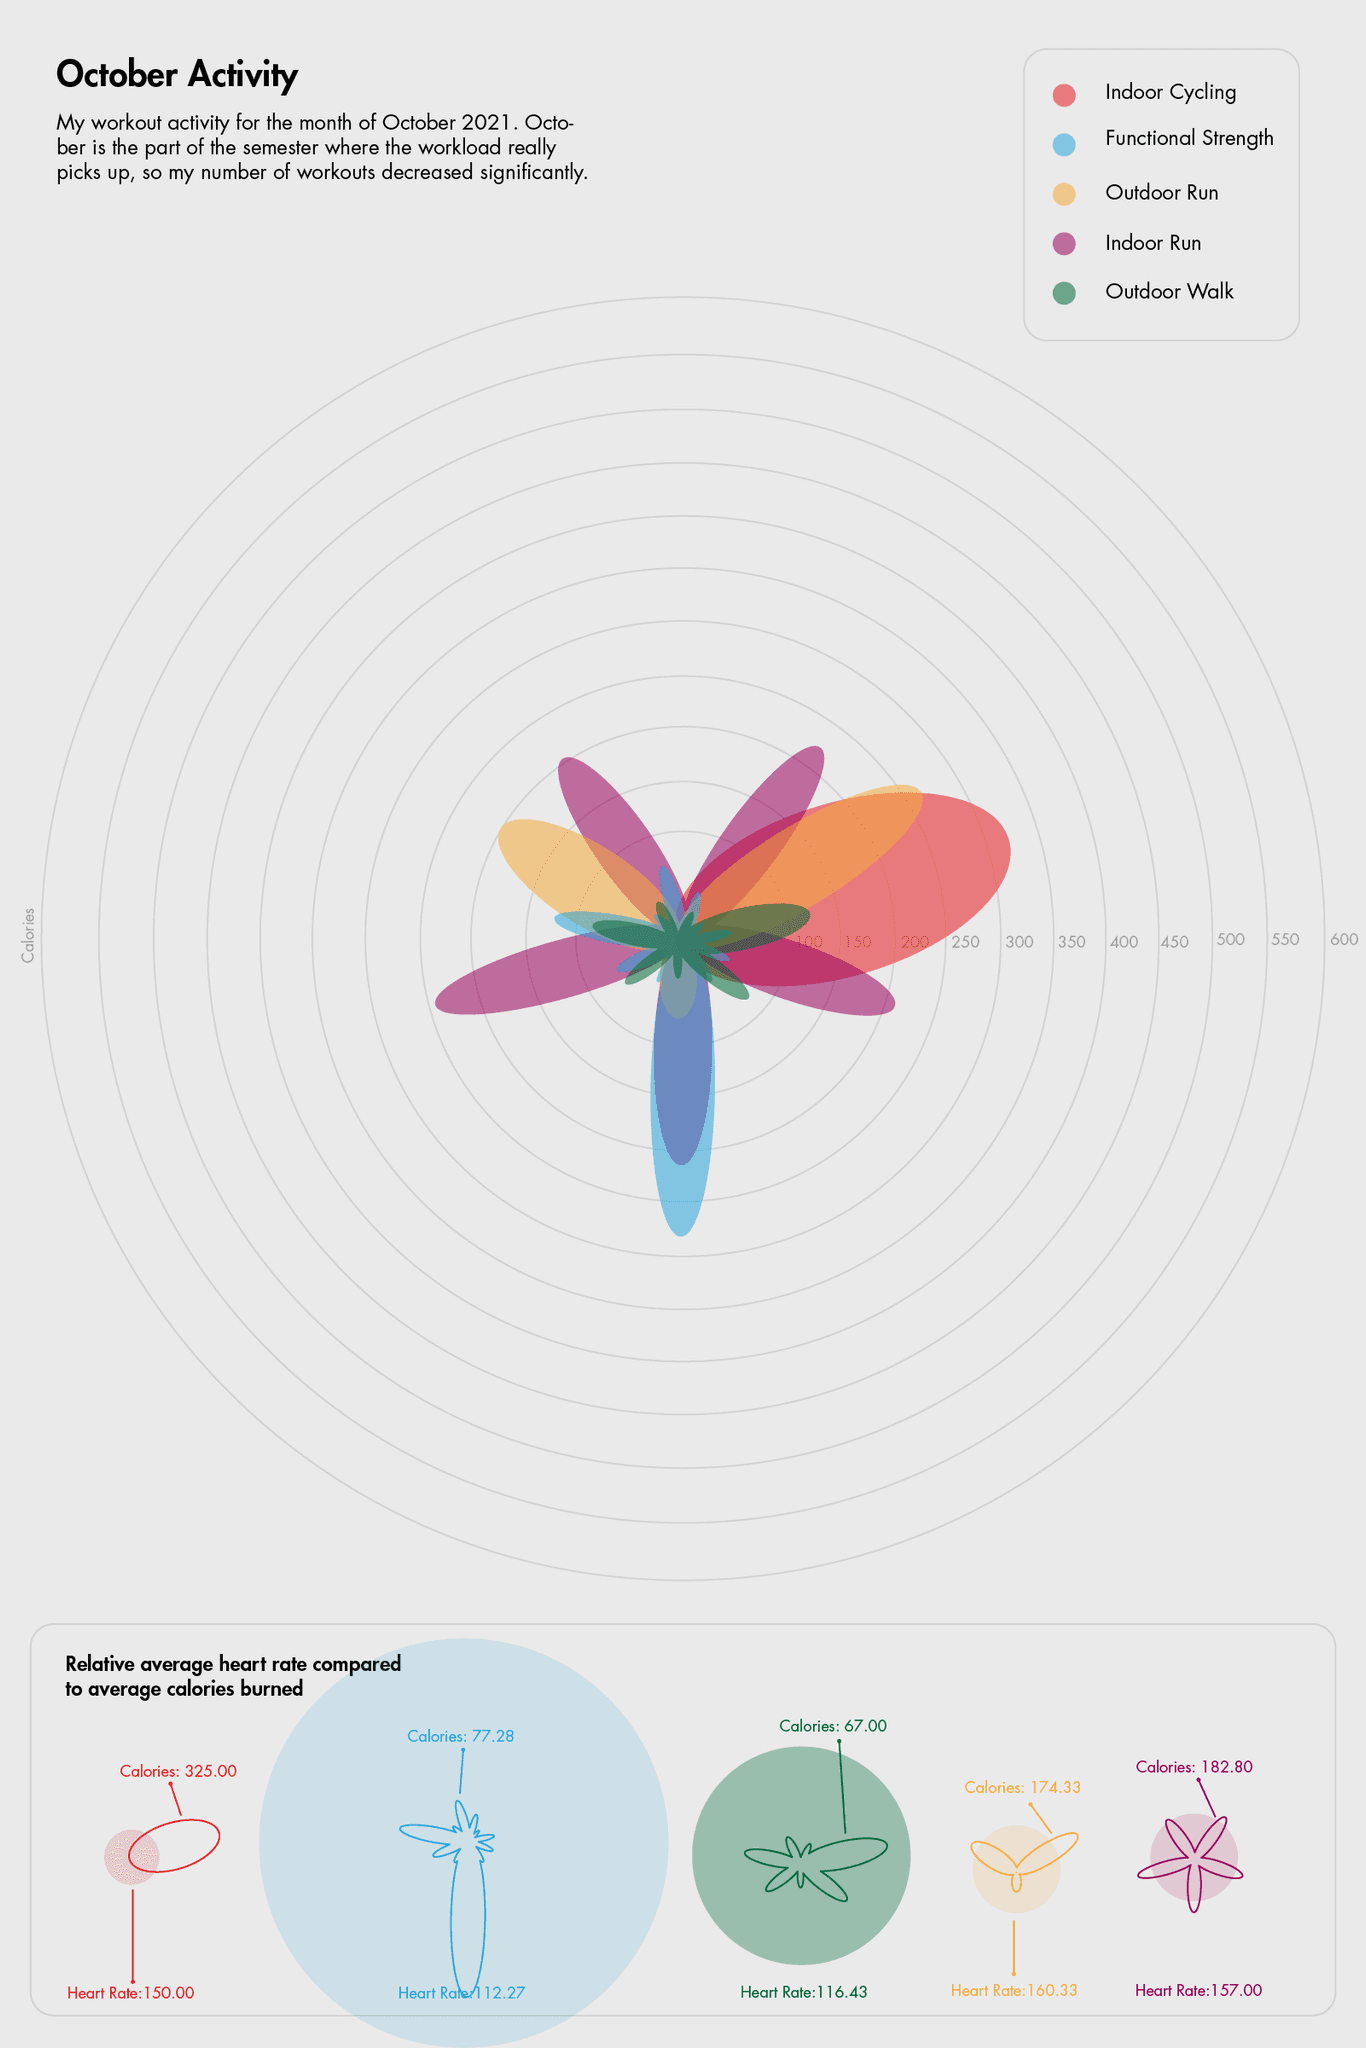
To help understand the graphs, each color represents a type of workout, and the length of the ‘petal’ is determined by the amount of calories burned. At the bottom of each poster, you can view the relative average heart rate compared against average calories burned for each workout in that month.








Total calories burned by month


A Year of Workouts
Visualizing workout data.
Tools
p5.js, Adobe Illustrator, Google Sheets
Description
This project contains a year's worth of workouts, visualized. To do so, I compiled all of my workout history into spreadsheets in order to have all the data contained in one place. I then used p5.js to create graphs with accurate data, and then I made the graphs a bit more interesting with Adobe Illustrator.
Monthly History
To help understand the graphs, each color represents a type of workout, and the length of the ‘petal’ is determined by the amount of calories burned. At the bottom of each poster, you can view the relative average heart rate compared against average calories burned for each workout in that month.


Total calories burned by month


